Transit Junction
- Mapbox GL
- React
- TypeScript
- Python
Overview
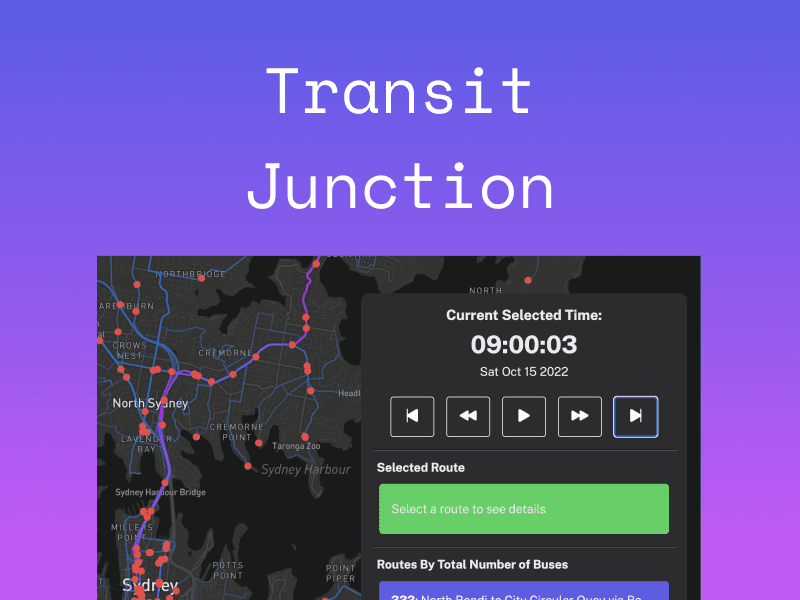
Transit Junction is a web app and data visualisation based on the real time positions of Sydney Buses, collected from the NSW Open Data Portal. The NSW Open Data Portal allows anyone to access many different data points about public transport in NSW, including static and updated timetable information, patronage statistics and the data I used, real time positions and route information. Transit Junction allows a user to play back the previous 24 hours of bus movements, collected in fifteen second intervals.
Background
This app was built partially as an assignment for my class in Information Visualisation, and partially as the base for a personal project I've been imagining for a while. We were required to take any data source and present it in a visually appealing way for the end user. I chose to use public transit data as I have a personal interest in maps and the importance of public transport in an urban environment.
Solution
Transit Junction maps the locations of all buses in the Greater Sydney Region for the previous day. Each coordinate is plotted as a circle on a map in fifteen second intervals. The coordinates can then be stepped through manually or automatically by pressing the play button, which allows for the map to come to life in an animated way. In addition to this, I’ve added in the routes, which are generated from a second source, the real time timetables API, another of the TfNSW Open data APIs. This allows the points to have a frame of reference for where they are moving, and also to provide the layouts of the streets from geographical data.
The data is collected on a VPS using multiple python scripts, and then a scheduled task runs to create geojson files, which can be fed into the Mapbox API running in a React App on the frontend.
Transit Junction is still a work in progress, and future steps will be to add mobile responsiveness, reduce network overhead and include data such as trains and ferries.